The 7 Must-Have Columns in your Google Ads Statistics Table

Think about the last new post that you made on Instagram or any social media platform. Remember how you kept checking for the post engagements for the first few hours after making the post?
You are going back to see how many likes, comments, shares, and tags that your post is getting. You are also looking to see if it is the same regular people who are engaging your post or new people are seeing you and like your content.
Why do we find ourselves always trying to check metrics like that after something as simple as making a social media post? It is simple. Human beings are wired to measure success and subconsciously get validation from how others respond to us.
It is the same way when it comes down to running ads. In business and digital marketing, the success of your ads and the profit you get is decided in stages. This is why you put so much into creating funnels that work.
The first set of cold traffic that pours into your funnel is what validates your ad copy, extensions, keywords, and targeting. It is the same way that your conversions validate your offer.
So, in today’s article, we will look at these stats that show us how our account is performing so that we can make improvements based on those metrics. We will also see the most important columns that contribute to our success while running ads.
The Google Ads Statistics Table: A quick Overview
The statistics table on Google ads is like a mirror that shows everything about the performance of your ad campaigns.
By just looking at one or two columns, you can have an idea of whether a certain business is making a profit or not.
The statistics table is a customizable table in your Google ads account that helps you to see detailed performance data of your ads. It is located right at the center of your ads account and can be used to view ad engagements like impressions, clicks, CTR, average cost-per-click, and cost per conversion, etc.
These statistics are shown in columns. While there are several columns and statistic figures that you can view, having too many figures in your face may be overwhelming. This ends up leaving you too mentally paralyzed to take any action.
Therefore, you should only add the most important and helpful columns to your statistic table to filter unnecessary information.
Customize your Statistics Table with Must-Have Columns
Note that the first word on that heading is ‘Customize’. This means that your statistics table should be completely personalized to suit your ad needs.
The must-have columns for you should be based on the purpose and intent of the ad that you created. Some ads are made for prospects who need instant solutions and are open to purchasing a solution right away.
Some other ads are created to generate cold leads for later follow-up in a closed audience. Depending on the intent for your ad, the columns on your statistics table should reflect specific metrics needed to measure your ad success.
Two major groups of metrics that are important for you to take note of are YOUR AD REACH and YOUR AD ROI (Return on investment).
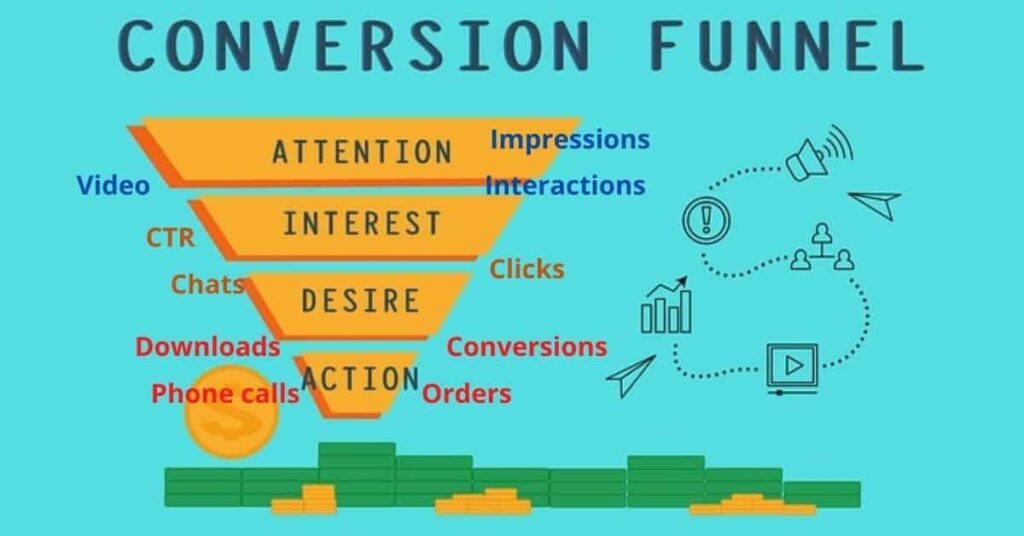
1.Your Ad Reach
The columns in this category reflect the performance of your ad in terms of the number of people who have interacted with your ad.
The numbers for your ad reach may include surficial engagements like ad impressions. They may also include final stage figures like conversions.
The must-have columns of your ad reach are:
- Impressions
This implies the number of times that your ad has shown to people or the number of people who have seen your ad. This is the first major column to keep your eyes on while running ads. Why? Because your ad impressions decide everything else.
If people do not see your ad, then there are no chances for them to even click or see what your solution is like. This way, you can neither make a profit nor gather a strong paying audience.
The amount of times that your ad is seen by people is dependent on how your intended keywords match with the searcher’s intent.
Therefore, if you are not getting any ad impressions or they become stagnant after a while, you should check out your bids and your ad budget. It may be that your bids are not competitive enough or that your budget has been exhausted.
If your ad impressions look like they are running fine, then other columns and metrics would matter.
- Clicks
If you set up a physical store in a moderately populated area, and everyone just passed by your store after looking at the storefront, would you not think something fundamental was wrong?
If all you have are ad impressions and people are not clicking to see the solution you are proffering, how much better would it be?
Definitely not good. After impressions, the next column to have and always keep your eyes on is the clicks column.
A high number of clicks shows that you are targeting the right people who need your product, services, or information at that time. A low number of clicks however may signify a wrong target audience or an ad copy that does not match the searcher’s question.
Clicks are always measured with the number of impressions which brings us to the next very important metric. The click-through rate.
- Click-Through Rate (CTR)
The click-through rate is the ratio of the number of clicks to the number of impressions. It is measured in percentage (%). When you have both clicks and impressions, the click-through rate is what explains the relation of both numbers and how they affect your ad results.
A high CTR will also mean that your ad is just right with the search intent. Depending on the average click-through rate in your niche or industry, your click-through rate may be termed as high or low.
2% CTR is not a bad rate according to Google. However, your aim as a marketer is to have a higher CTR than the average click-through rate in your industry.
The more your message matches the searcher’s mind, the more clicks you can get.
Therefore, you aim to concentrate on solving the searcher’s innate problems.
- Conversions
Conversions are like the top of the Google ads staircase. Conversions are the destination. Impressions and clicks are the journeys. The number of conversions equates to the number of people who take action on your offer after seeing and clicking on your ad.
Conversions for you might mean prospects signing up for a product or a sample to be delivered to them at a certain refundable price. For some others, it might mean for prospects to schedule a consultation call with the organization.
Regardless of the action or offer, you want to make sure that people are taking action and not just turning back at the sight of your landing page.
Zero or low conversions may signify a big objection to the final action on your landing page. Therefore, you need to keep this column on your statistics table so that you can measure your final success rate.
- Conversion Rate (CVR)
The conversion rate column is not any less important than the conversions column. Your conversion rate will give you the ratio of your conversions to your clicks in percentage.
This will give you a larger view as to what the numbers are saying and if your rate is better than the average in your industry. Your conversion rate is more important than your click-through rate.
While they work hand-in-hand, you do not want to be caught in the web of having a higher CTR and low CVR.
The above are the main columns that you should have on your statistics table in your ad reach category. Next, we will talk about how your money relates to all this. Where and how your money is going and how it is coming back to you.
2.Your ROI
Your return on investment includes both your investment and then the profit after regaining your investment.
The money game on Google ads is important and there are must-haves in this category on your statistics table. That way, you can know if you are making a profit or you are just in a bad business loop.
Most of the columns in this section compare investments or money spent to profits or money earned. Let us check out the must-haves.
- Cost per Click (CPC)
This is the major investment and where all your advertising budget goes to. Your cost per click is the amount that you pay when one person clicks on your ad from the search engine results page (SERP).
Most of your ad budget is spent here. Therefore, it is important to have this column on your statistics table. It helps you to know if you are underpaying or overpaying for your clicks.
Remember that your ad spend should be proportional to your goals. Therefore, underpaying may result in a lower ad rank while overpaying may be equivalent to tossing your money away.
While your cost per click largely depends on the average in your industry and the triggered keyword, you want to give just the right amount to acquire that customer. This increases your profitability and success rate.
- Cost
Your cost per click shows you how much you pay for a single click. The cost column shows you the total amount that all your impressions and clicks have cost you.
The importance of this column is that you can see how far away or close you are to your initial budget for the ad. The column shows you what you have spent so far.
The question you should always ask after seeing this column is: ‘Are my results worth this amount?’ If you feel like the acquisitions and conversions that you have made are worth the money spent, you are most likely on the right track.
If not, you may need to take a look at all the other metrics and see what you need to change or tweak to get better results.
Conclusion
A quick tip for you is that you can easily add up columns that are important for you or remove the ones that you do not need to see often in just a few steps.
When measuring your success in Google advertising, there is no one-size-fits-all. All you need to do is to define the intent and purpose of your ad and use that to measure how successful it has been.
Also, you can keep building your success rate as you go. Keep trying new things while keeping your eyes on your reach (the number you draw) and your return (how your money flows).
For any help with your PPC management, contact me through the Contact page.